Web Analytics
Sessions: This refers to a single user’s interactions with your website in a fixed time frame. Sessions can be generated by new users or returning users.
Number of Sessions per User: The total number of sessions divided by the total number of users.
Avg. Session Duration: This measures the average length of sessions on your website. Google Analytics begins counting a session from the moment a user lands on your site, and continues counting until the session ends (e.g., the user exits the site or is inactive for a predetermined amount of time).
% New Sessions: This measures the percentage of sessions that were generated by new visitors to your website. By tracking this metric, you gain an understanding of your website’s retention rate as well as the extent to which new visitors are interested in your site.
Depending on your business goals, it may be desirable to increase new sessions over time, especially if growth or reach is your primary focus.
Conversion Rate (CR): The average number of conversions per ad interaction, shown as a percentage. Conversion rates are calculated by simply taking the number of conversions and dividing that by the number of total ad interactions that can be tracked to a conversion during the same time period: CR = (# of conversions) / (# of total interactions)
New vs. Returning Visitors: New visitors are users who have never been to your website, according to Google’s tracking snippet. Returning users have visited your site before.
When someone views your website, Google’s tracking snippet looks for a tracking cookie on their device:
- If the cookie is not present, Google creates one and considers this a new user.
- If the cookie is present, Google considers this a returning user and starts a new session.
Pages/Session: The average number of pages viewed during a session, including repeated views of a single page.
Bounce Rate: A ‘bounce’ (often called a single-page session) happens when a user lands on a website page and exits without triggering another request to the Google Analytics server. The definition of bounce rate is the percentage of sessions that result in a bounce—that is, sessions that begin and end on the same page. Each page’s bounce rate affects a website’s overall bounce rate. Bounce rate can be calculated by taking the number of single-page sessions and dividing by the total number of sessions.
- Tracking bounces can help you understand how visitors are using individual pages on your site.
- Tracking data highlighting whether users interact with the page or not can also support optimization and marketing decisions.
Tracking bounces can be particularly relevant to landing pages. If you invest a lot of resources to drive people to a landing page, only to have them leave without interacting or progressing through to the rest of your site, consider:
- Optimizing your landing page so your visitors have a clear understanding of their next steps.
- Investing your resources in a different (or new) page or campaign.
Note: Bounce Rate will be replaced with Engaged Sessions when the data source switches to Google Analytics 4 (GS4).
What Is an Engaged Session?
An engaged session is defined as a session that:
- Spent 10 seconds or more on the site/app, or
- Viewed 2 or more screens/pages, or
- Had a conversion event.
For example, if a user came to the site or app, spent one minute reading a page, and then left without taking any further action, then in Universal Analytics (the older version of Google Analytics) this user session was considered a bounce. In Universal Analytics, there was no way to calculate the amount of time a user spent on a single page without using third-party tools.
However, in the case of Google Analytics 4, the amount of time spent on single pages is measured. This user session is considered an engaged session, and is counted towards engagement rate.
Engagement rate: This is a measurement of how many members of your audience have interacted with your content versus how many people have seen it (impressions).
Organic Traffic
Google Analytics states that it separates traffic that arrives at your site through a search engine result from traffic that arrives through other referring channels, like paid advertisements or another site that links to yours. In your reports, this traffic segment is called Organic Traffic.
Organic Traffic Best Practices
Some examples of techniques used for organic SEO include:
- Using keyword opportunity and keyword ranking.
- Backlinking and link building to improve link popularity.
- Writing content relevant for human readers.
Sometimes, users switch up the keyword phrases that they use to make a purchase decision. Better keyword research can help you understand what they are actually searching for.
Traffic Sources
Beyond organic and direct traffic, you must understand the difference between all of your traffic sources. You also need to know how traffic is classified.
Most web analytics platforms, like Google Analytics, utilize an algorithm and flowchart based on the referring website or URL parameters that determine the source of traffic. Here is a breakdown of all sources:
- Direct: Any traffic where the referrer or source is unknown
- Email: Traffic from email marketing that has been properly tagged with an email parameter
- Organic: Traffic from search engine results that is earned, not paid
- Paid search: Traffic from search engine results that are the result of paid advertising via Google Ads or another paid search platform
- Referral: Traffic that occurs when a user finds you through a site other than a major search engine
- Social: Traffic from a social network, such as Facebook, LinkedIn, Twitter, or Instagram
- Other: If traffic does not fit into another source, or has been tagged as “Other” via a URL parameter, it will be bucketed into “Other” traffic
SEO Dashboard
Domain Rating (DR): This metric is measured on a logarithmic scale from 0 to 100, with the latter being the strongest. Although DR correlates strongly with a website’s search traffic, you should not focus your efforts on growing this metric specifically.
Google ranks pages—not websites. Your efforts should be focused on producing high-quality content and acquiring high-quality backlinks directly to that content. Both your DR and your search traffic will grow naturally as a result.
Backlinks Basics and Site Traffic
What Is a Backlink?
Backlinks are hyperlinks that point from one website to another. You can have multiple backlinks from a website or web page.
What Is a Referring Domain?
Referring domains are websites from which the target website or web page has one or more backlinks.
For example:
- If a web page has a backlink from the New York Times, then it has one referring domain.
- If it has a backlink from the New York Times and Forbes, then it has two referring domains.
- If it has two backlinks from the New York Times, then it still only has one referring domain.
Follow vs. NoFollow Links
Follow links (also referred to as DoFollow links) are the ones that you want to work hard for—this type of link helps your site to gain Google authority and rank higher.
In contrast, a NoFollow link is a way for a website that links to yours to say, “Don’t pass any SEO value to this site I’m linking to.” They might do this because you paid for the link or to avoid link spam.
How Do Referring Domains and Backlinks Influence Traffic?
If you want more organic traffic, backlinks and referring domains are crucial. In fact, recent in-depth research showed an interesting correlation: the vast majority of pages (of 1 billion pages analyzed) without referring domains got no traffic from Google.
Link building involves different tactics with a similar goal: acquiring high-quality backlinks from authoritative websites to boost your own website’s authority and ranking. However, there’s only one approach when faced with lost or broken backlinks—link reclamation. It sounds intimidating, but it’s one of the most effective tactics for improving backlink profiles in a short time frame.
What Is Link Reclamation?
Link reclamation is the act of finding lost & broken links and taking steps to fix and reclaim them. Links being lost or broken happens in a variety of ways. Some of the most common culprits are:
- The webmaster or author removes the link
- The webmaster removes the page linking to your website (404 error)
Fixing Lost and Broken Backlinks
Once you’ve collated your website’s broken backlinks, you’ll need to reach out to the webmaster of the specific website and ask them to fix the broken link.
Since there’s a possibility that you’ve reached out to this webmaster before for link-building purposes, you’ve hopefully already established a connection with them which you can use to your advantage.
All About Anchor Text
Anchor text refers to the clickable portion of words used to link one web page to another.
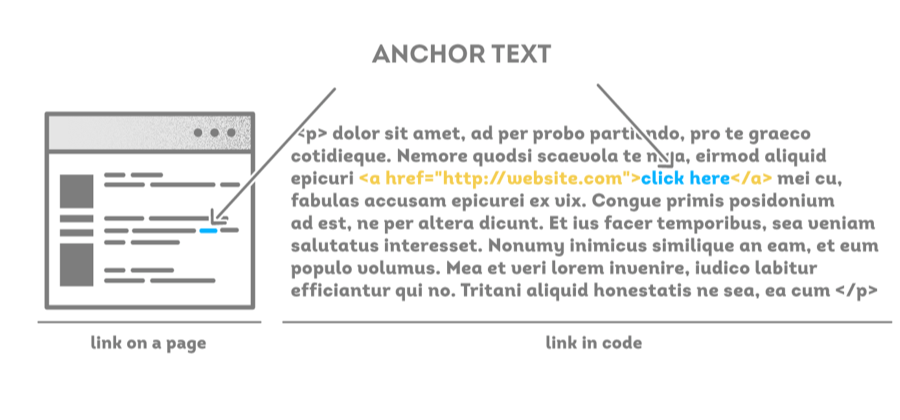
In the image above, words highlighted in blue represent the anchor text.
How Does Anchor Text Influence Search Engine Rankings?
Google employs a number of techniques to improve search quality, including page rank, anchor text, and proximity information. The text you choose to include within your anchor matters!
If you linked to a page with the anchor text “dog biscuits,” that would indicate to Google that the linked page likely has something to do with dog biscuits. If other people do the same thing, that increases Google’s confidence that the page in question should potentially rank for “dog biscuits.”
Search Console
Clicks: The number of clicks on your website URLs from a Google Search results page, not including clicks on paid Google Ads search results.
Queries: The Google Search queries that generated impressions of your website URLs in Google organic search results.
Impressions: The number of times any URL from your site appeared in search results viewed by a user, not including paid Google Ads search impressions.
Average Position: The average ranking of your website URLs for the query or queries. For example, if your site's URL appeared at position 3 for one query and position 7 for another query, the average position would be 5: ( (3+7)/2 ) = 5.
Click-Through Rate (CTR): Click-through rate, calculated as ((ClicksImpressions)*100) = CTR, represents how frequently your audience is genuinely interacting with your ads. Average CTRs for Google Search results range from 2% to 30%, depending on the position.
If your CTR for Google Search ads is around 2% or higher, you can give yourself a pat on the back. That's generally considered a good CTR. However, depending on your industry and goals, the target you set for CTR can fluctuate.